Reporting
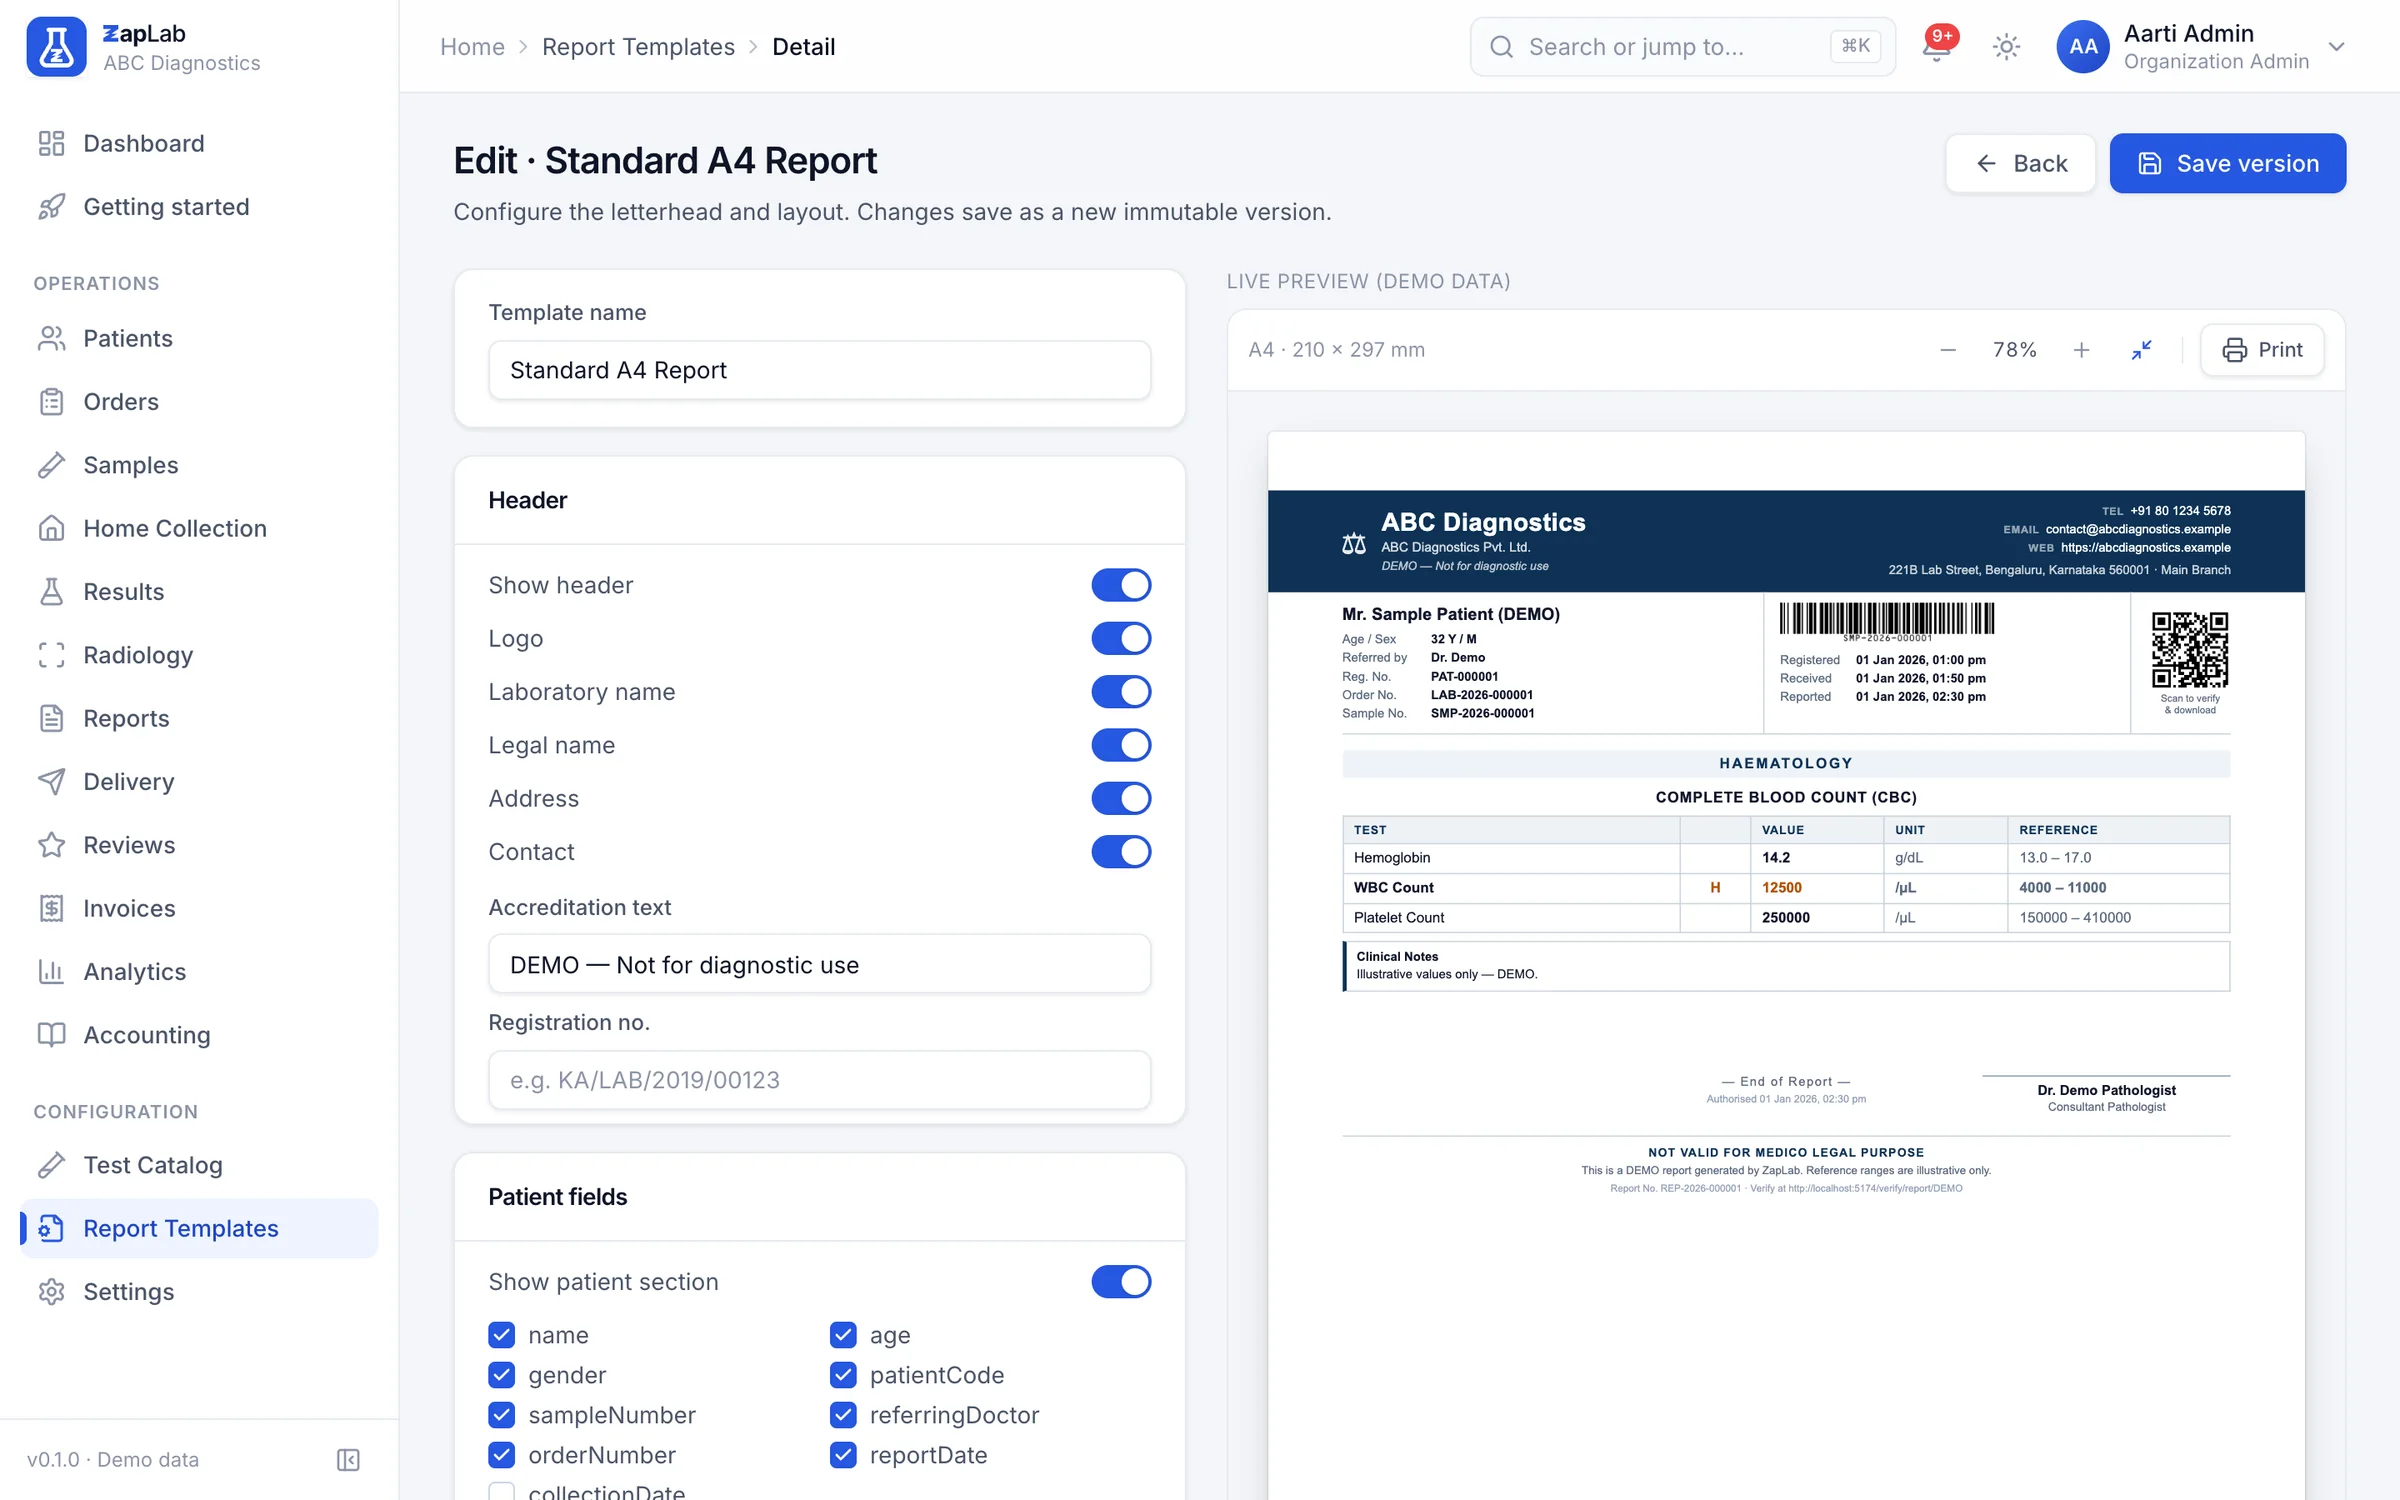
The report is what the lab actually sells. You build the template once, and every released report comes out of it as a PDF with your letterhead, your signatories and a QR code anyone can scan to check the report is genuine.
Six pages, one for each part of the system. Each of them names what it does, shows the screen it does it on, links the repository file behind the claim, and ends with a list of what that part cannot do yet.
They share one catalogue, one patient record and one audit trail, so the shipped library of 157 report formats is the same catalogue the front desk bills from and the pathologist signs against.
The report is what the lab actually sells. You build the template once, and every released report comes out of it as a PDF with your letterhead, your signatories and a QR code anyone can scan to check the report is genuine.
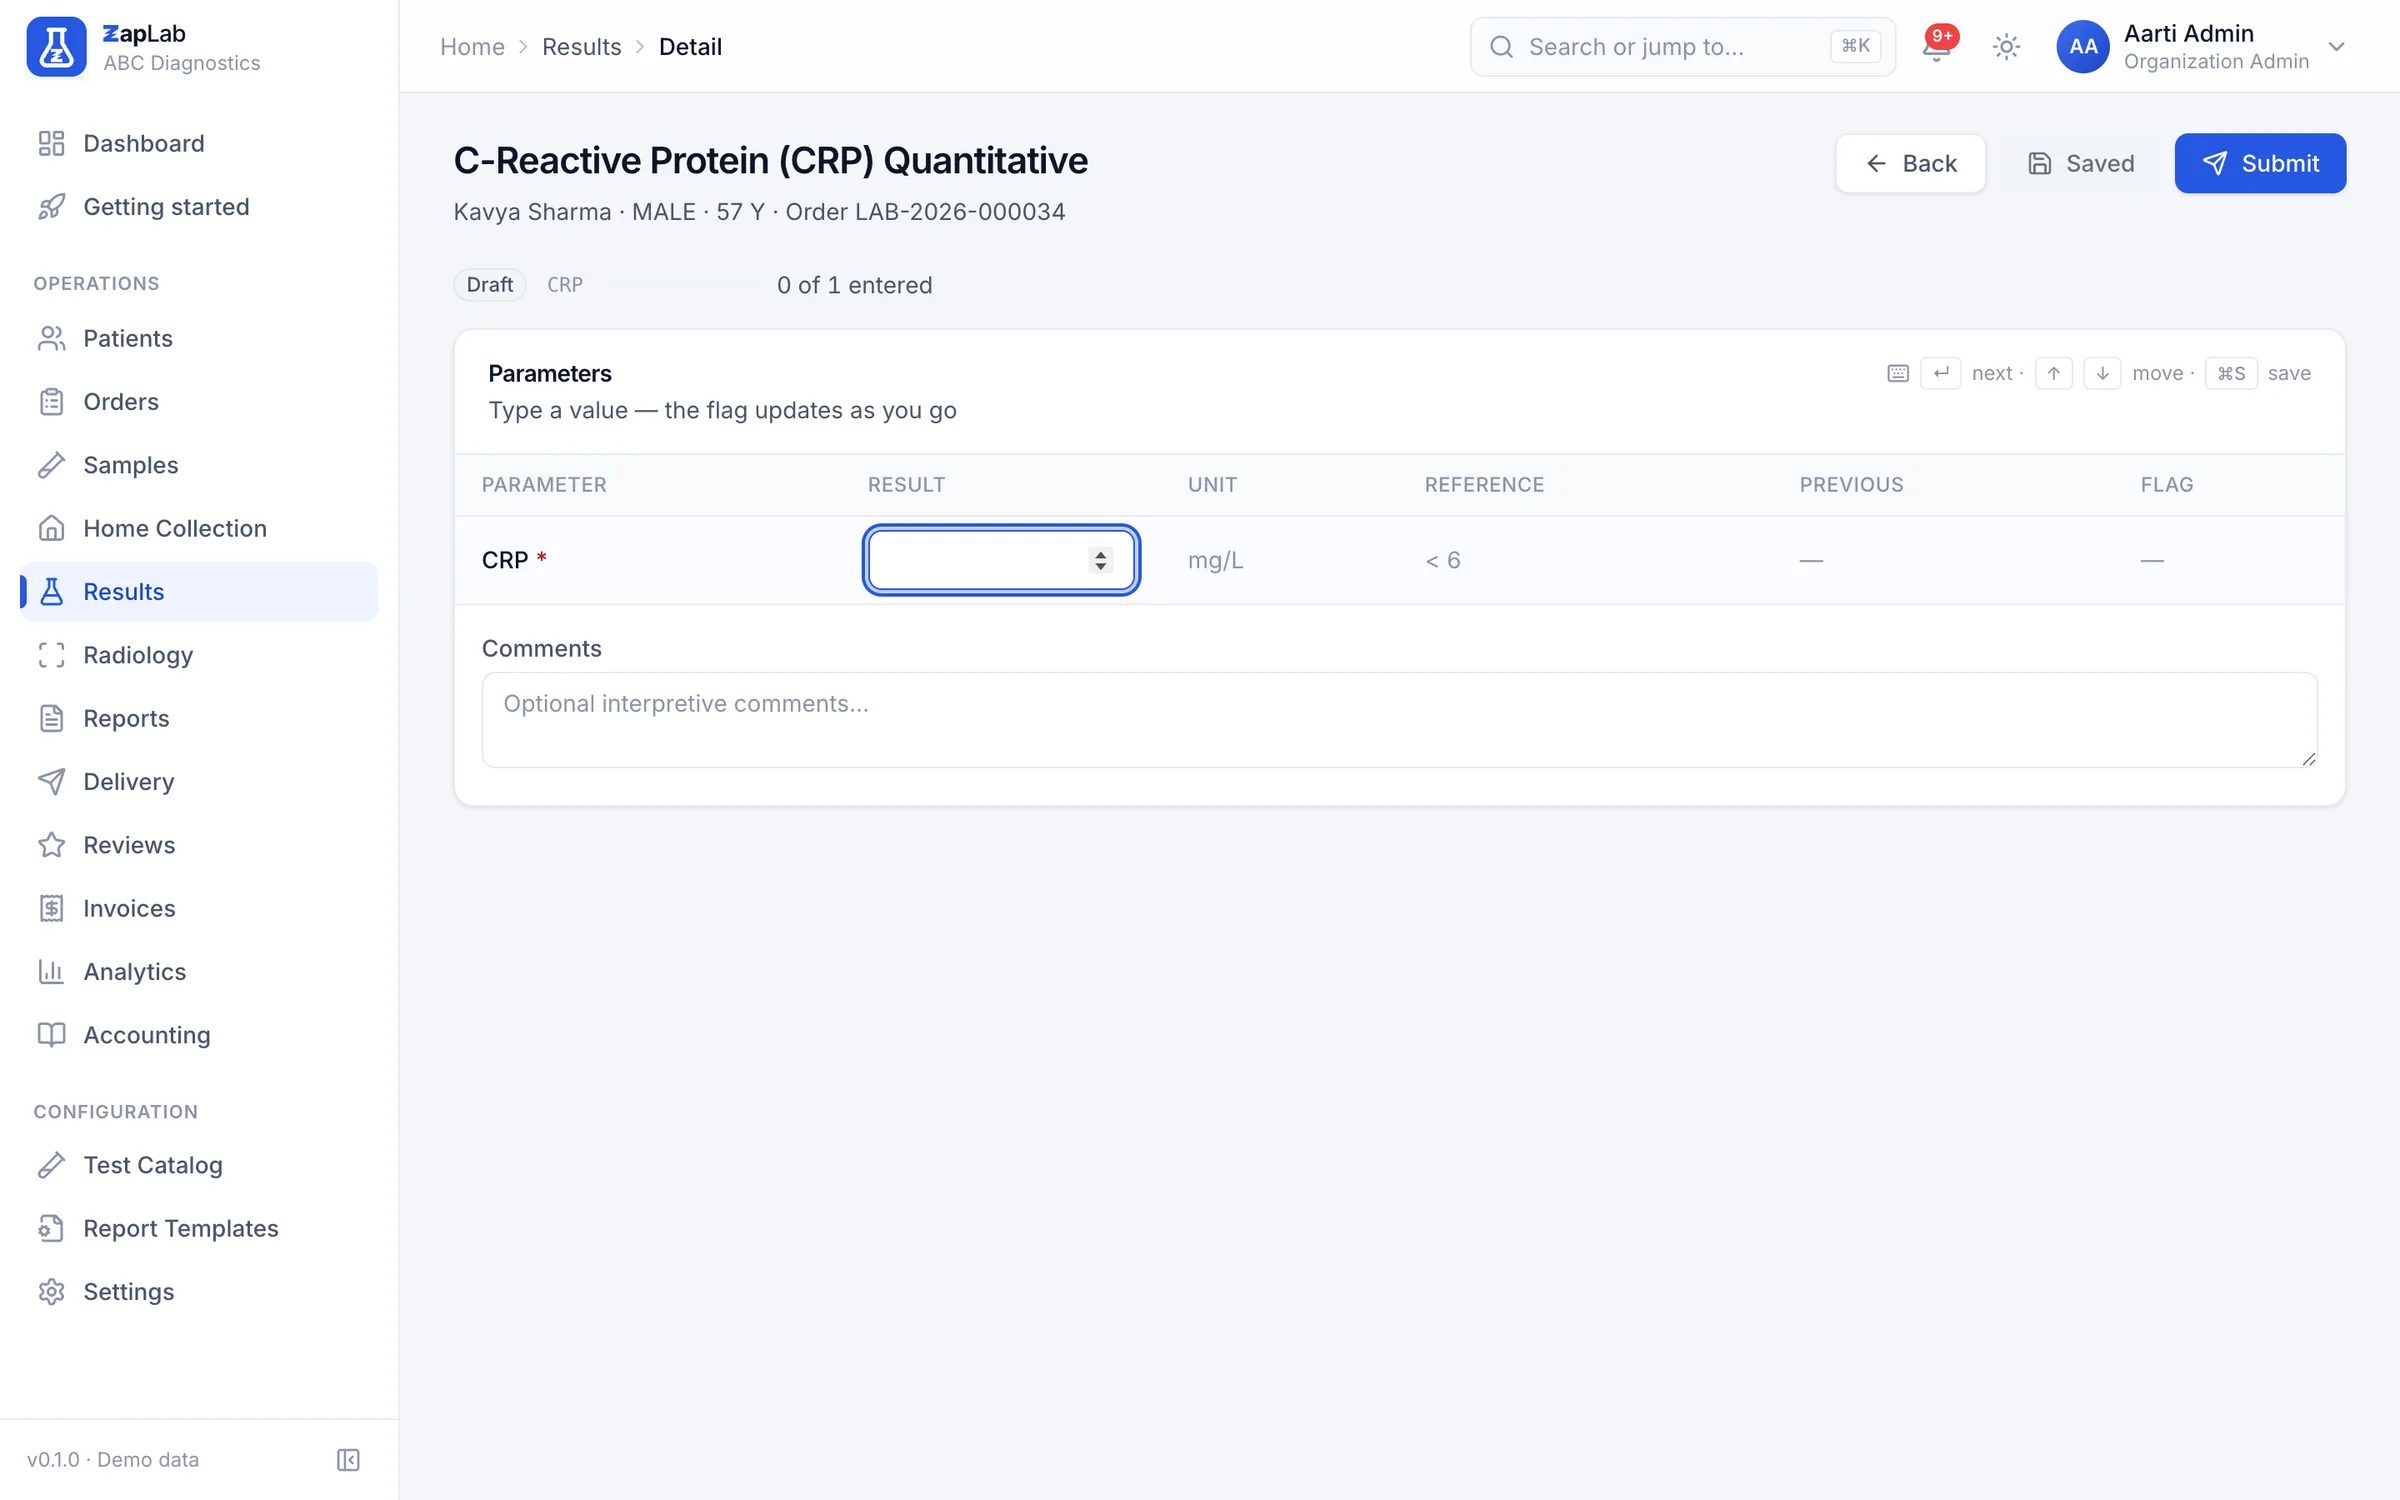
Results are typed once and the system does the rest: it picks the reference range that fits the patient in front of you, marks what is high, low or critical, fills in the calculated parameters, and refuses to let anything reach a patient without a sign-off.
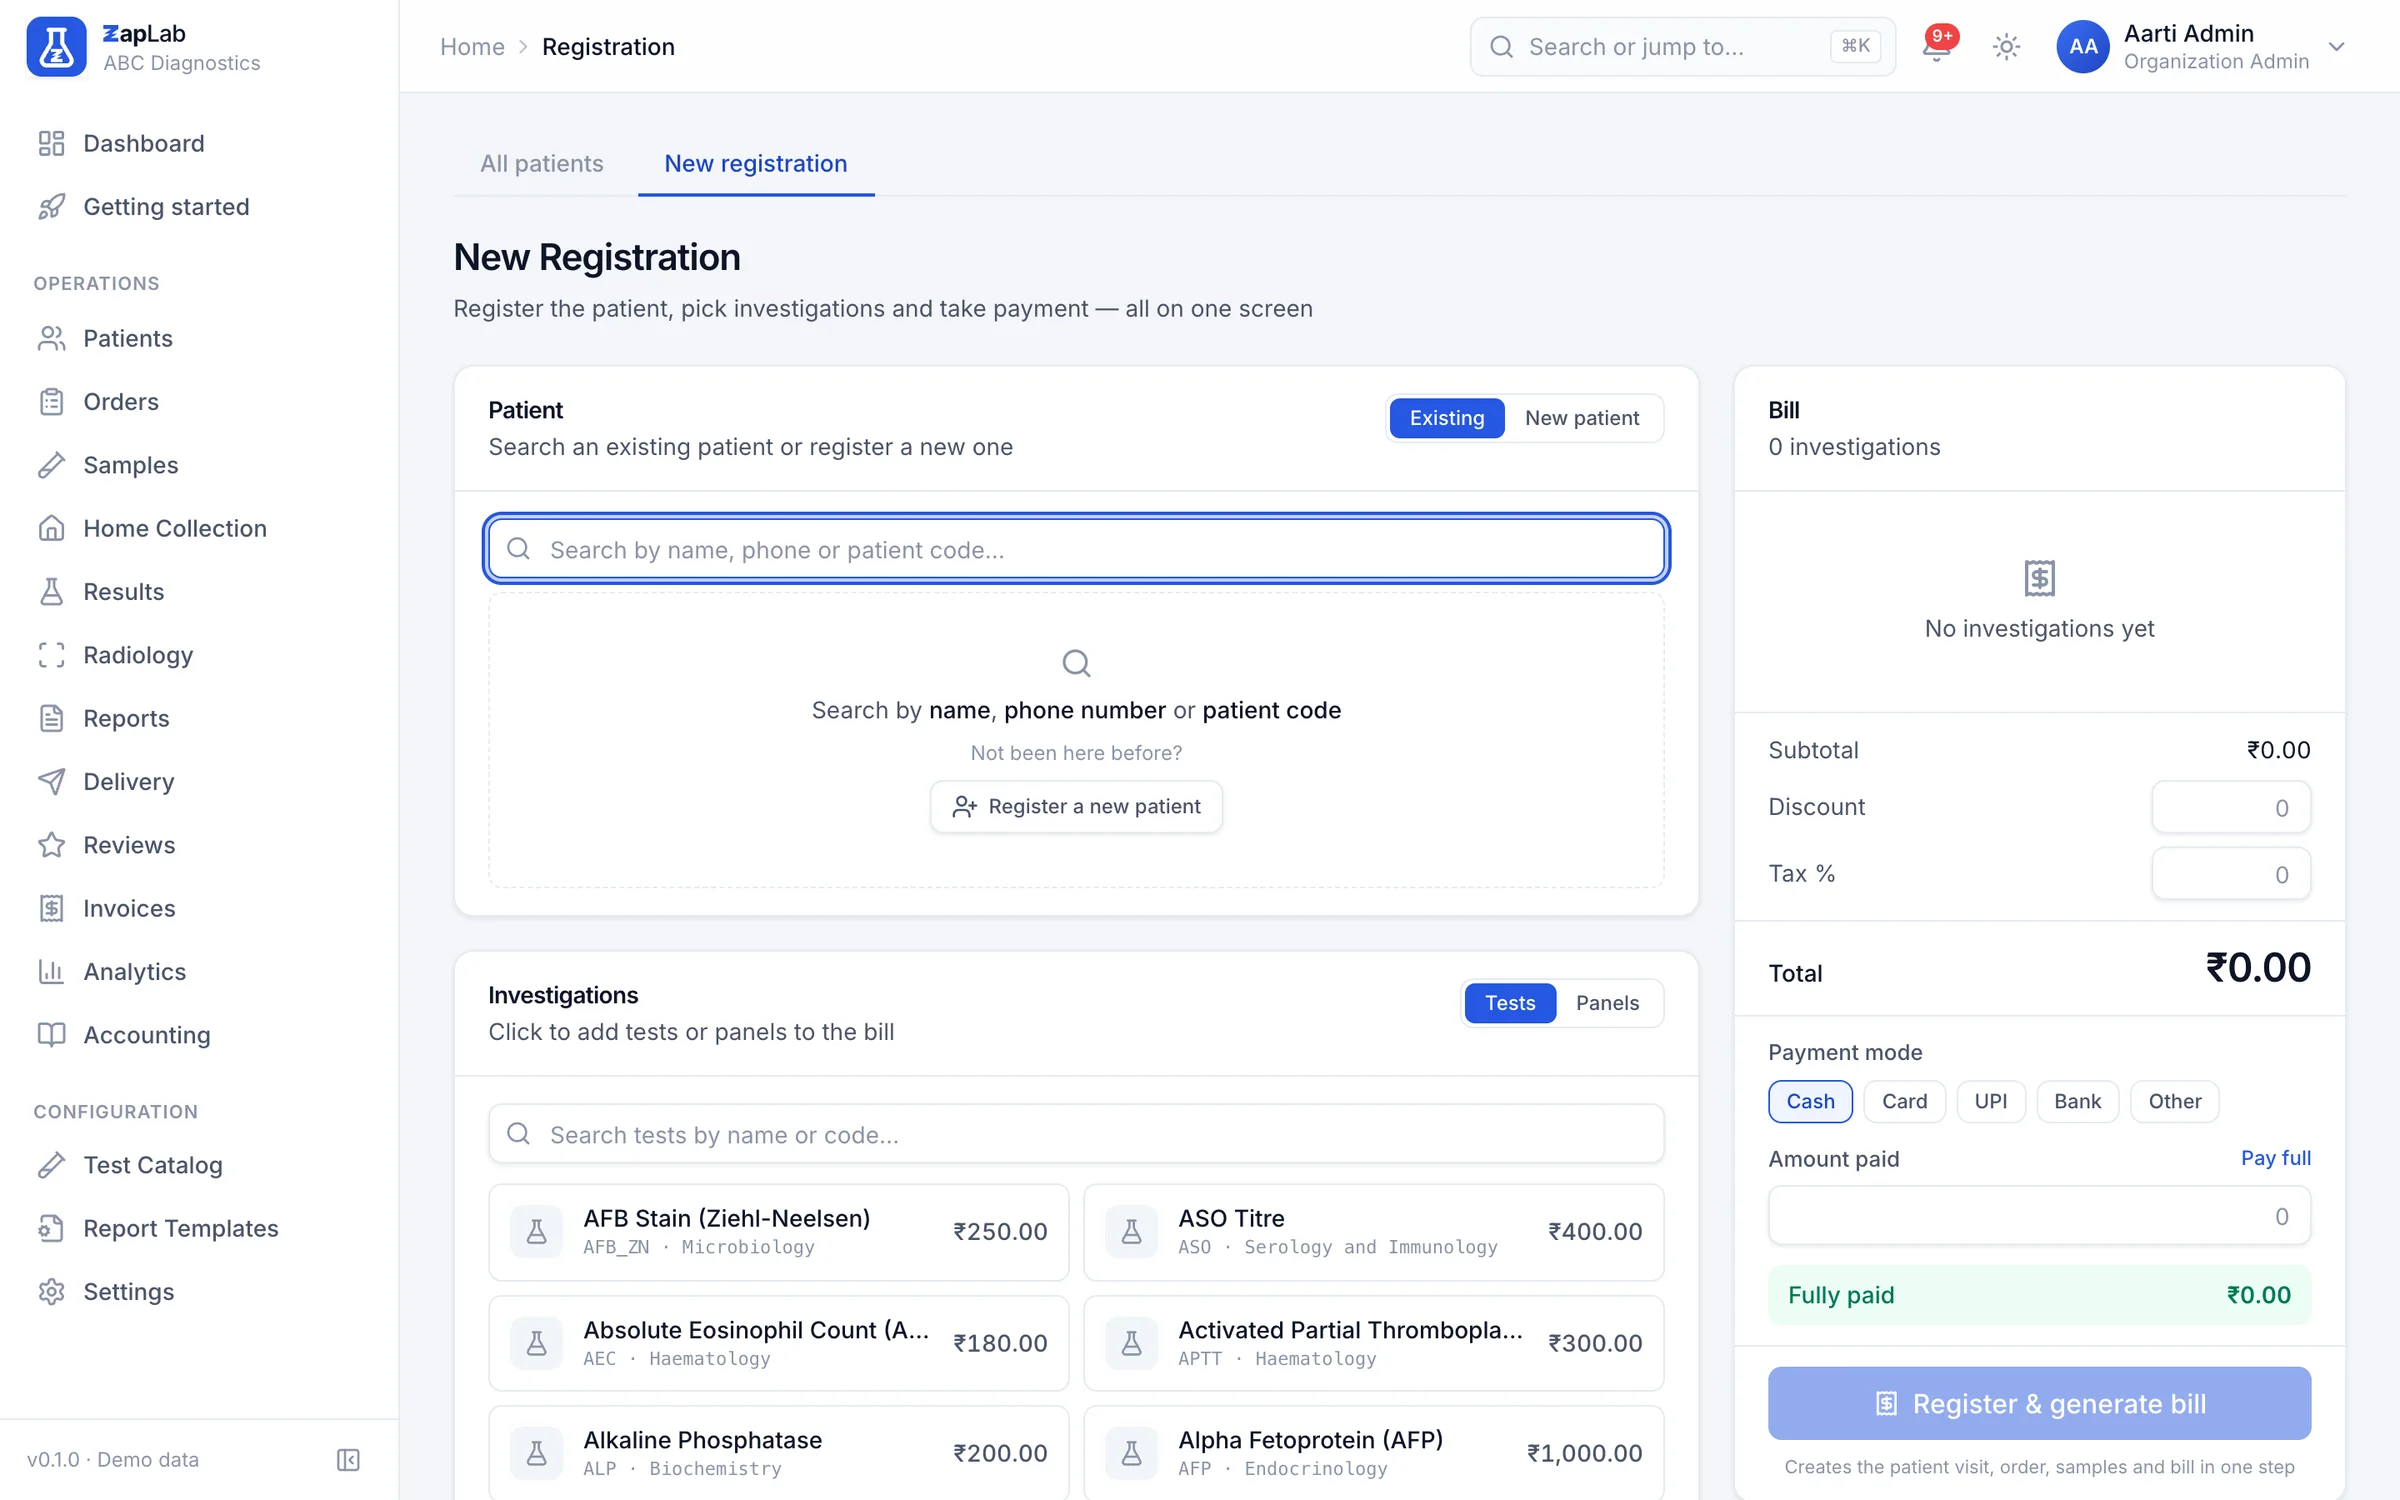
The front desk is where a lab’s errors start. Registration puts the patient, the tests and the bill on one screen, prints a barcoded bill on the printer you already own, and gives the patient a QR code to follow the order.
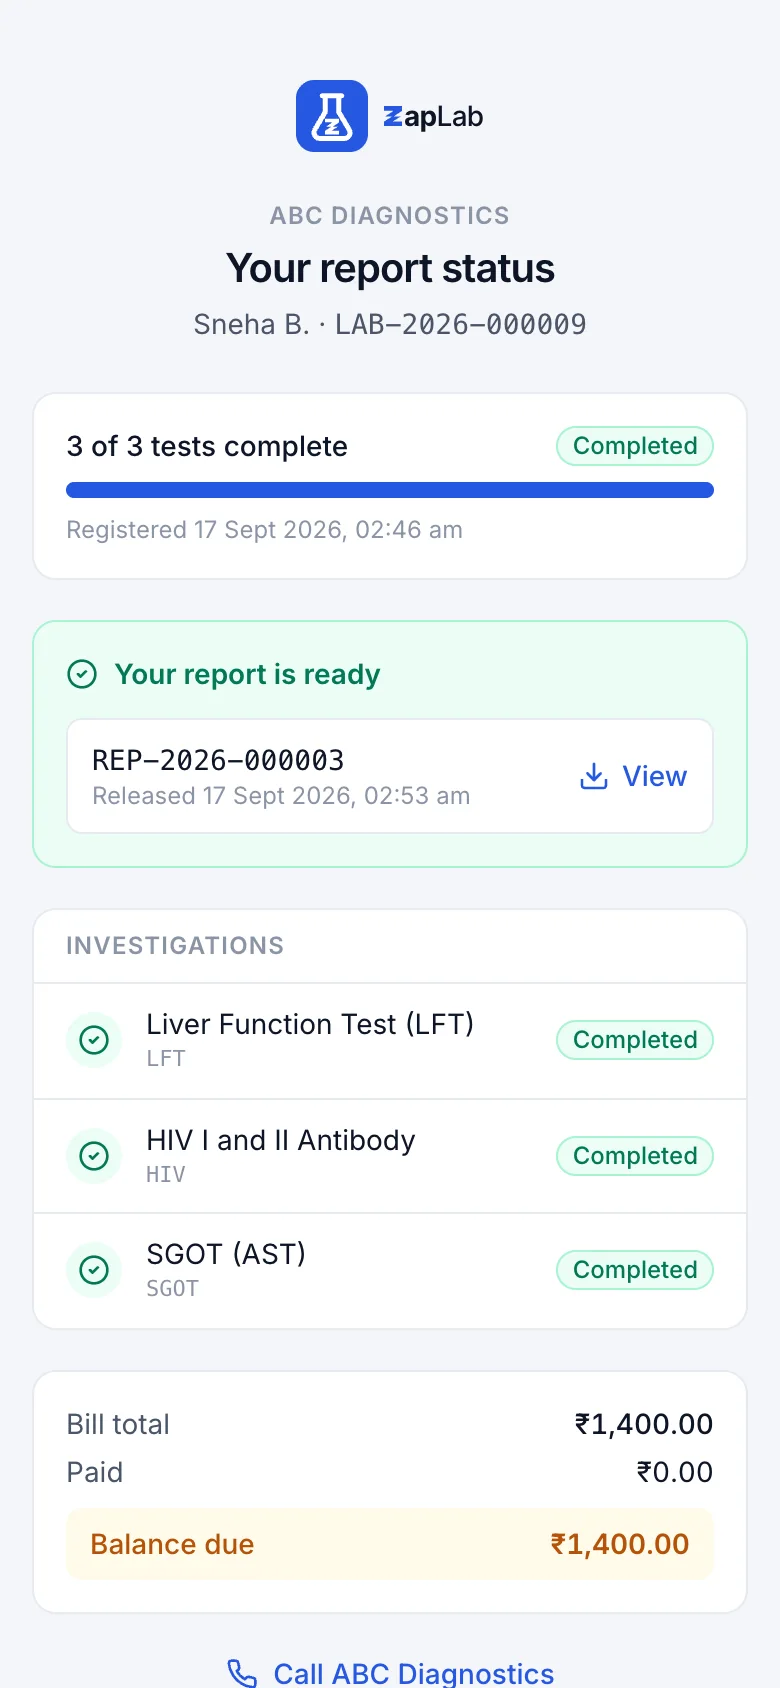
A report that sits in the system has not been delivered. Send it by email, SMS or WhatsApp, keep a log of what went where, and let the patient follow the order and verify the report from the QR code on the bill.
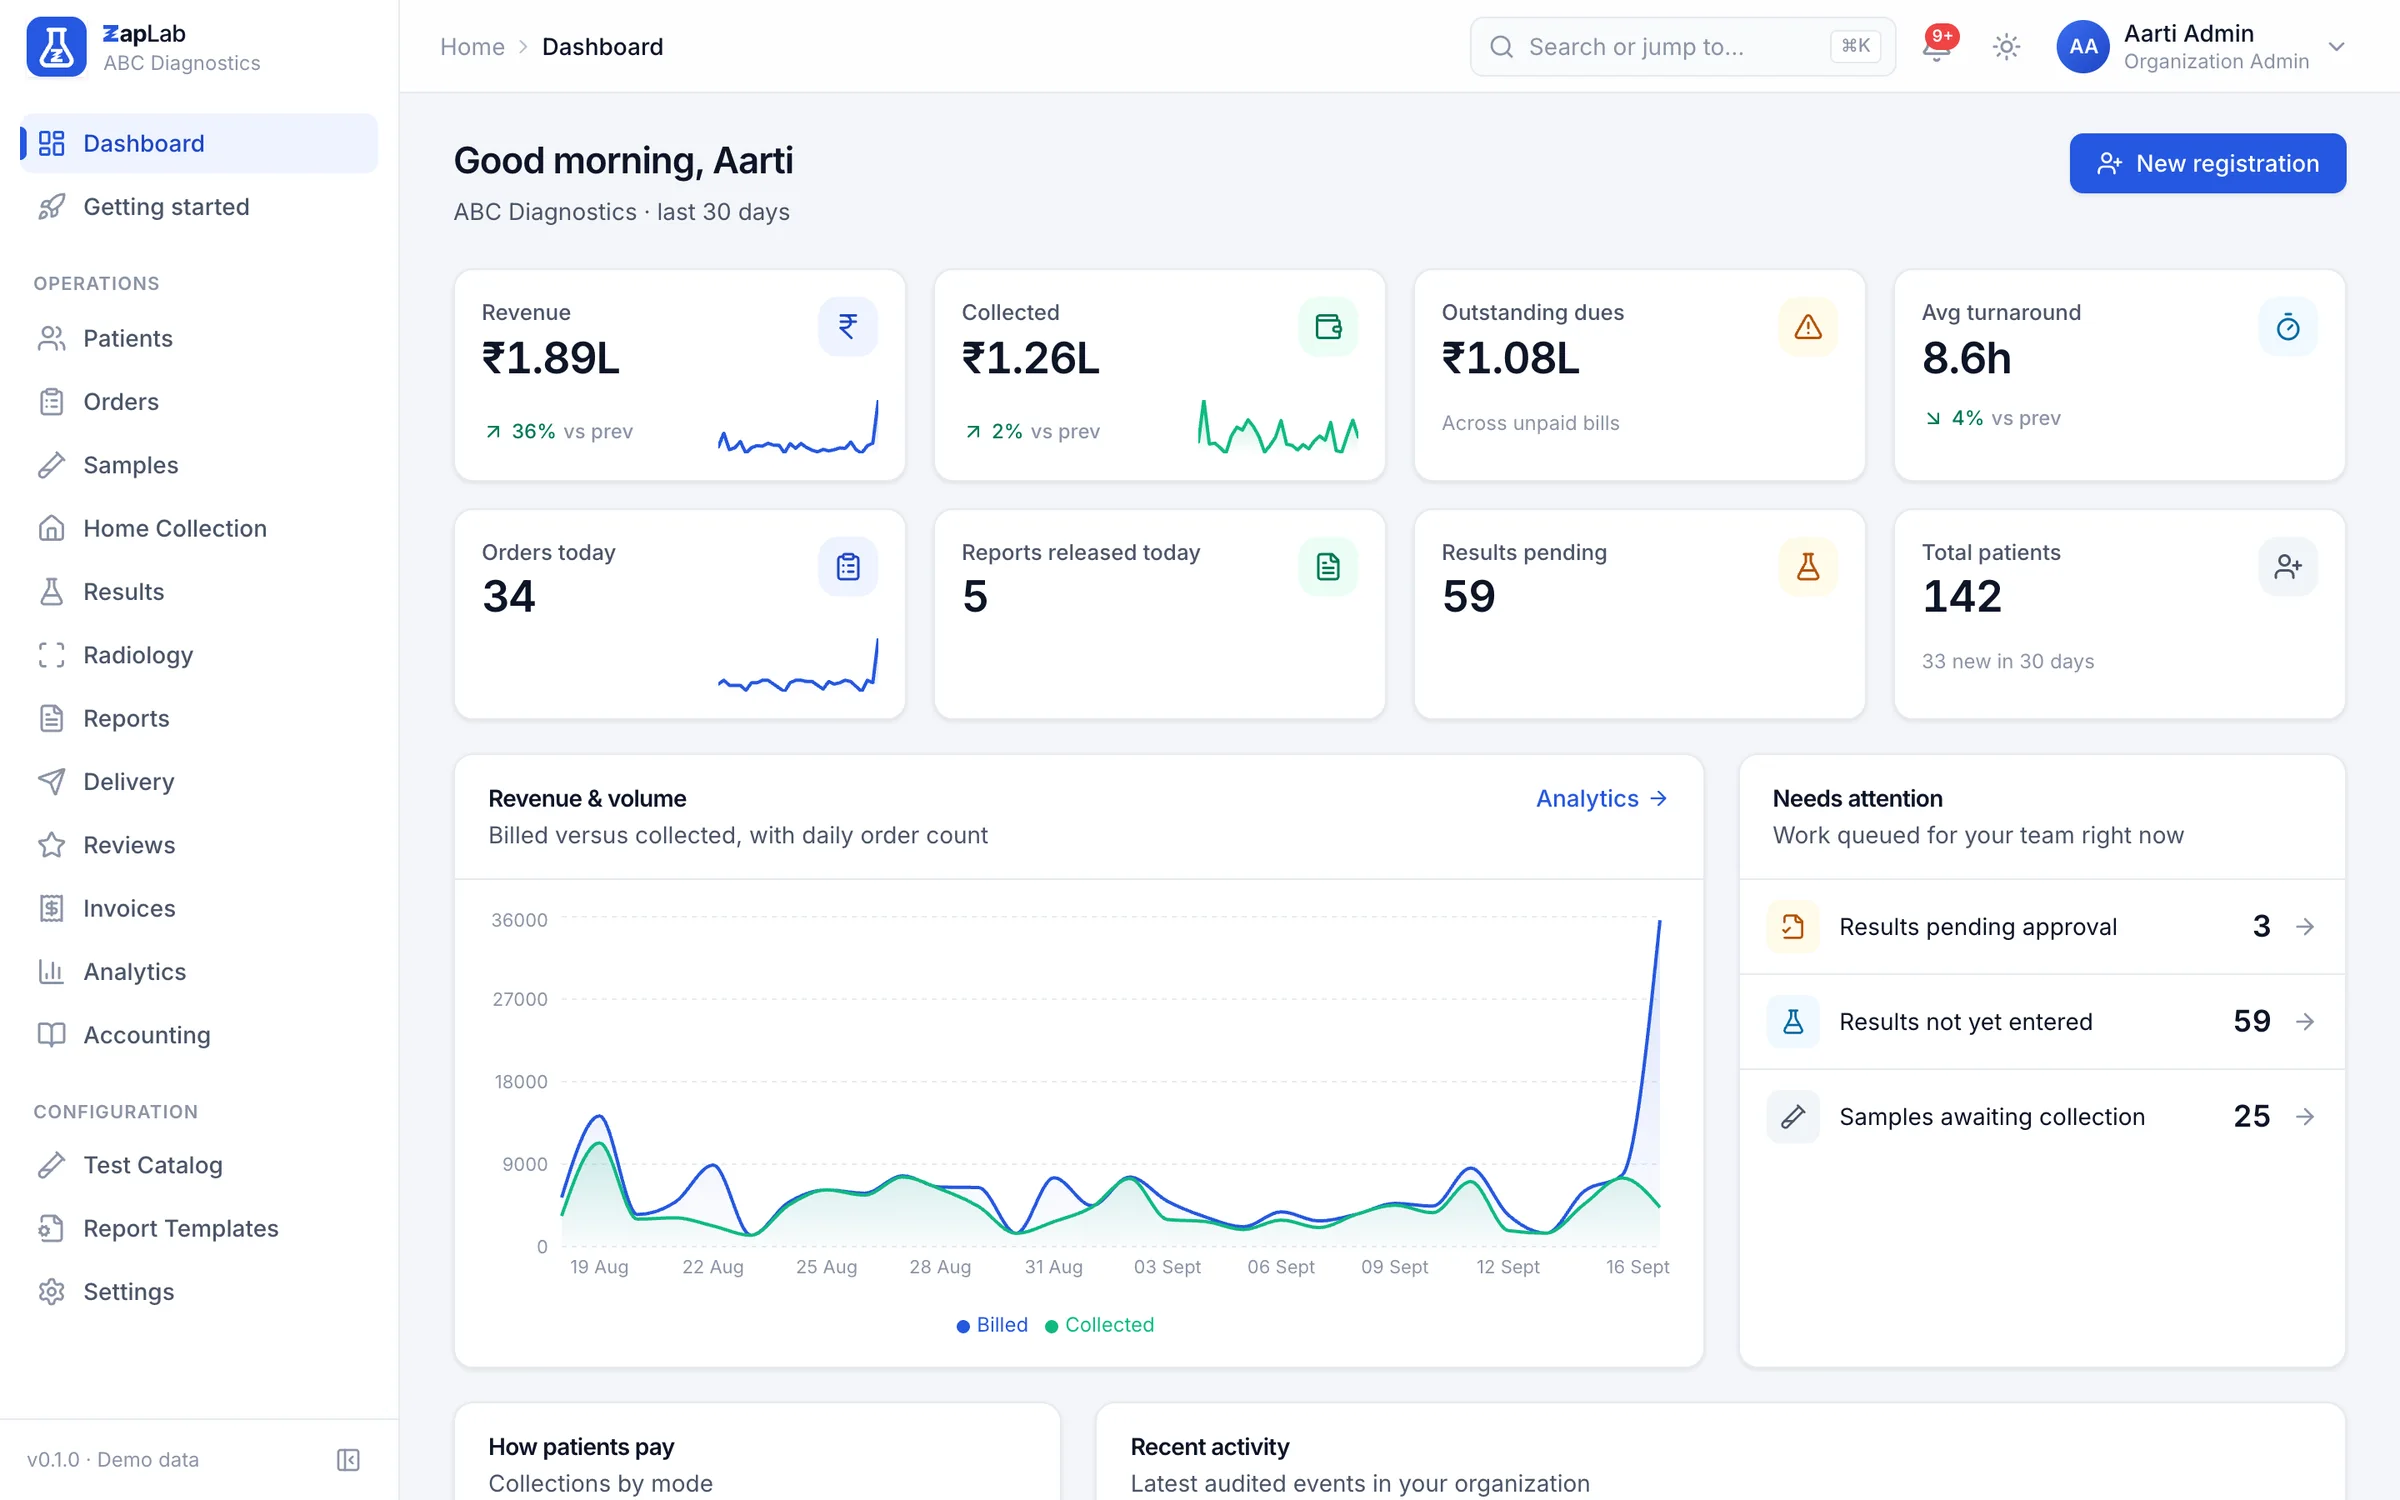
Four views and a day book, built from the work the lab has already done: what was billed against what was collected, which tests carry the revenue, how long reports actually take, and which referring doctors send work.
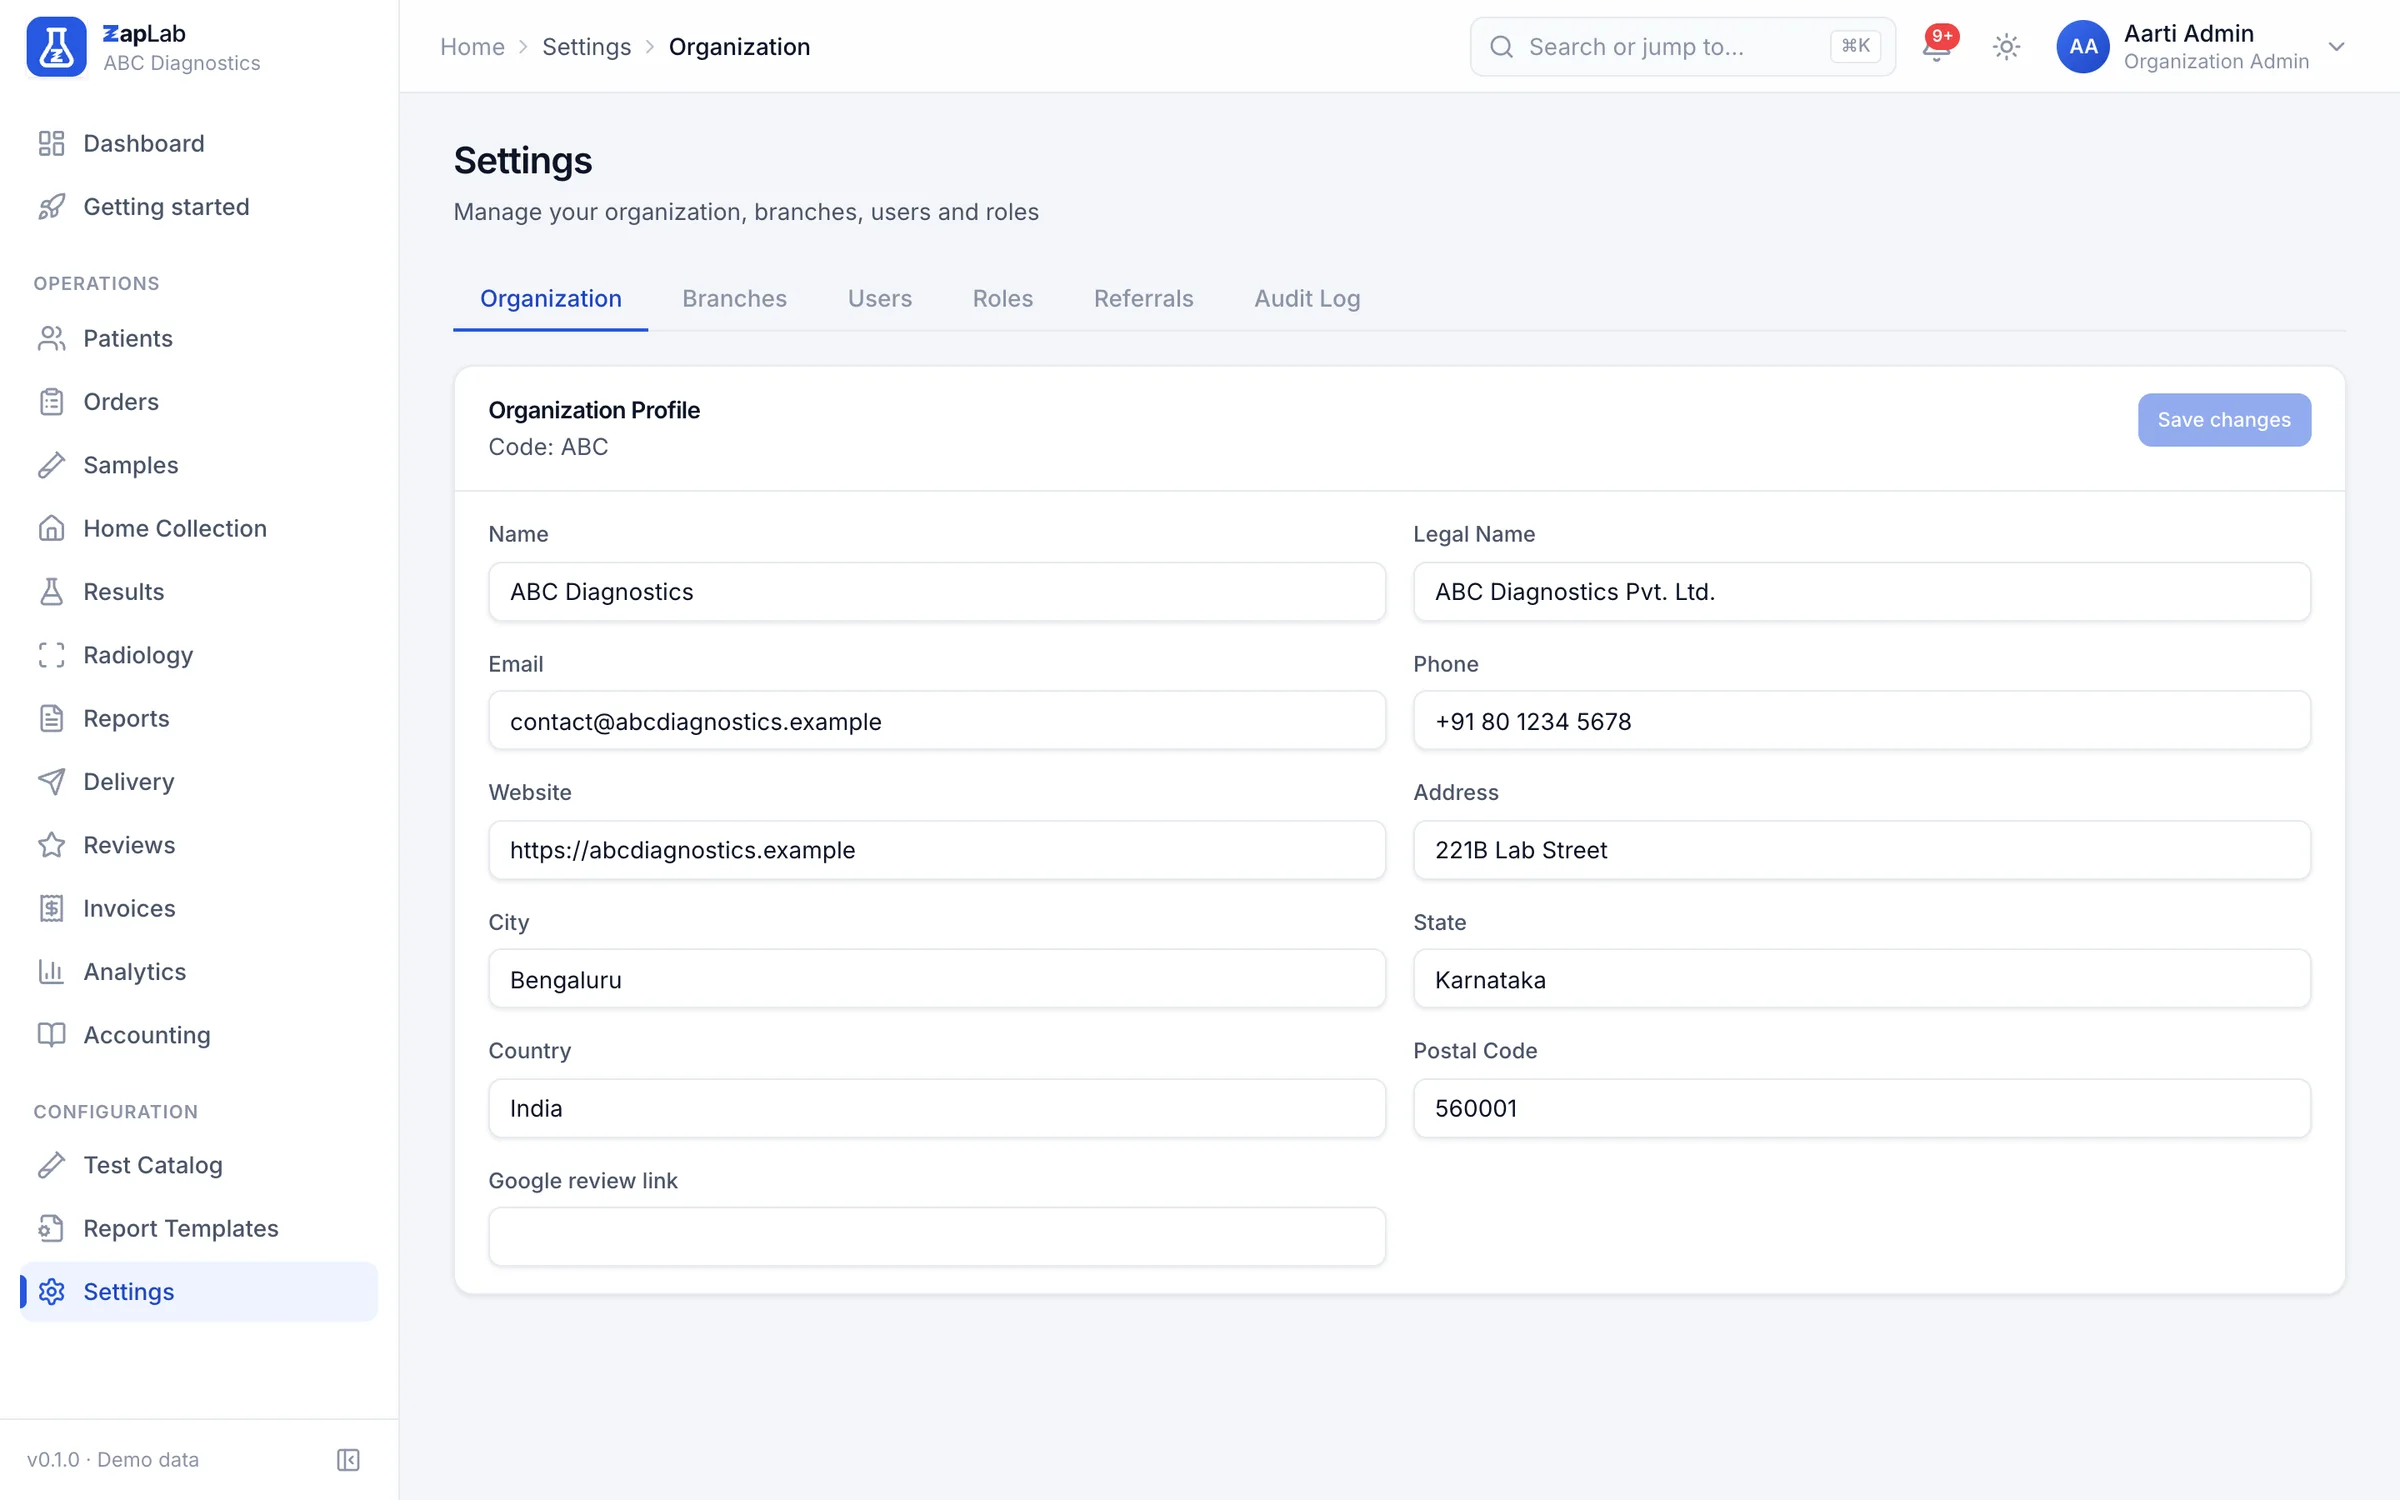
Built for a lab with more than one room and more than one person who can sign. Branches sit under one account, every screen is permission-checked on the server, and the audit trail is written by the system rather than by the user.
The feature pages describe the system. These pages let you check it.
Every multi-parameter format has its own page, with its parameters, units and reference ranges.
Reports rendered as the system prints them, with the template toggles live.
Against Word and Excel, against installed offline software, and against other cloud software.
Where the data lives, who can reach it, and what is recorded when it changes.
Create your organisation, add your tests, print the first barcode. If you would rather see it first, ask for a walkthrough.