Sample lab reports
Five reports rendered by the same components as the report on the home page, from the 157 formats that ship with the platform. Every value is demo data for a fictional patient; the parameters, units, decimal places and reference ranges are the ones you would install.
Five reports, and the switches that change them
The switches are settings in the report template editor. Flip one and all five reports below change, the way they change for every report your lab prints.
Complete Blood Count (CBC)
18 parameters, 5 of them calculated · 2 h turnaround
Demo datafictional patient, sample values
ABC Diagnostics
18 Jyoti Nivas Road, Koramangala, Bengaluru 560095
Your accreditation line prints here
- Report
- RPT-2026-01917
- Sample
- S-260912-024
- Patient
- Priya Menon (demo)
- Age and sex
- 34 y, female
- Patient ID
- ABC-2026-0311
- Referred by
- Dr. R. Krishnan
- Collected
- 12 Sep 2026, 08:15
- Reported
- 12 Sep 2026, 10:05
Complete Blood Count (CBC)
Haematology · Whole Blood (EDTA) · CBC
| Parameter | Result | Unit | Reference | Method |
|---|---|---|---|---|
| Haemoglobin | 11.4L | g/dL | 12 – 15Female | Automated Cell Counter |
| RBC Count | 4.10 | million/µL | 3.8 – 4.8Female | Automated Cell Counter |
| PCV / Haematocrit | 34.5L | % | 36 – 46Female | Automated Cell Counter |
| MCVcalculated | 84.1 | fL | 83 – 101 | Automated Cell Counter |
| MCHcalculated | 27.8 | pg | 27 – 32 | Automated Cell Counter |
| MCHCcalculated | 33.0 | g/dL | 31.5 – 34.5 | Automated Cell Counter |
| RDW-CV | 13.2 | % | 11.6 – 14 | Automated Cell Counter |
| Total Leucocyte Count (TLC) | 7400 | /µL | 4000 – 11000 | Automated Cell Counter |
| Neutrophils | 58 | % | 40 – 80 | Automated Cell Counter |
| Lymphocytes | 32 | % | 20 – 40 | Automated Cell Counter |
| Eosinophils | 4 | % | 1 – 6 | Automated Cell Counter |
| Monocytes | 5 | % | 2 – 10 | Automated Cell Counter |
| Basophils | 1 | % | 0 – 2 | Automated Cell Counter |
| Absolute Neutrophil Countcalculated | 4292 | /µL | 2000 – 7000 | Automated Cell Counter |
| Absolute Lymphocyte Countcalculated | 2368 | /µL | 1000 – 3000 | Automated Cell Counter |
| Platelet Count | 246000 | /µL | 150000 – 410000 | Automated Cell Counter |
| MPV | 9.8 | fL | 6.5 – 12 | Automated Cell Counter |
| RBC Morphology | Normocytic, normochromic | Automated Cell Counter |
Parameters marked calculated are computed by the system from the measured values on this sheet, not typed in.
Critical limits on the flagged parameters: Haemoglobin < 7 or > 20 g/dL. No value in this report has reached one.
Interpretation
Two values fall outside the reference range for this patient’s sex and are flagged. The red cell indices are calculated from the measured count. Correlate clinically.
Dr. Meera Nair, MD (Pathology)
Electronically signed 12 Sep 2026, 10:05
Dr. Anil Kumar, MD (Pathology)
Second signatory
Scan to verify
this report
Page 1 of 1 · End of report
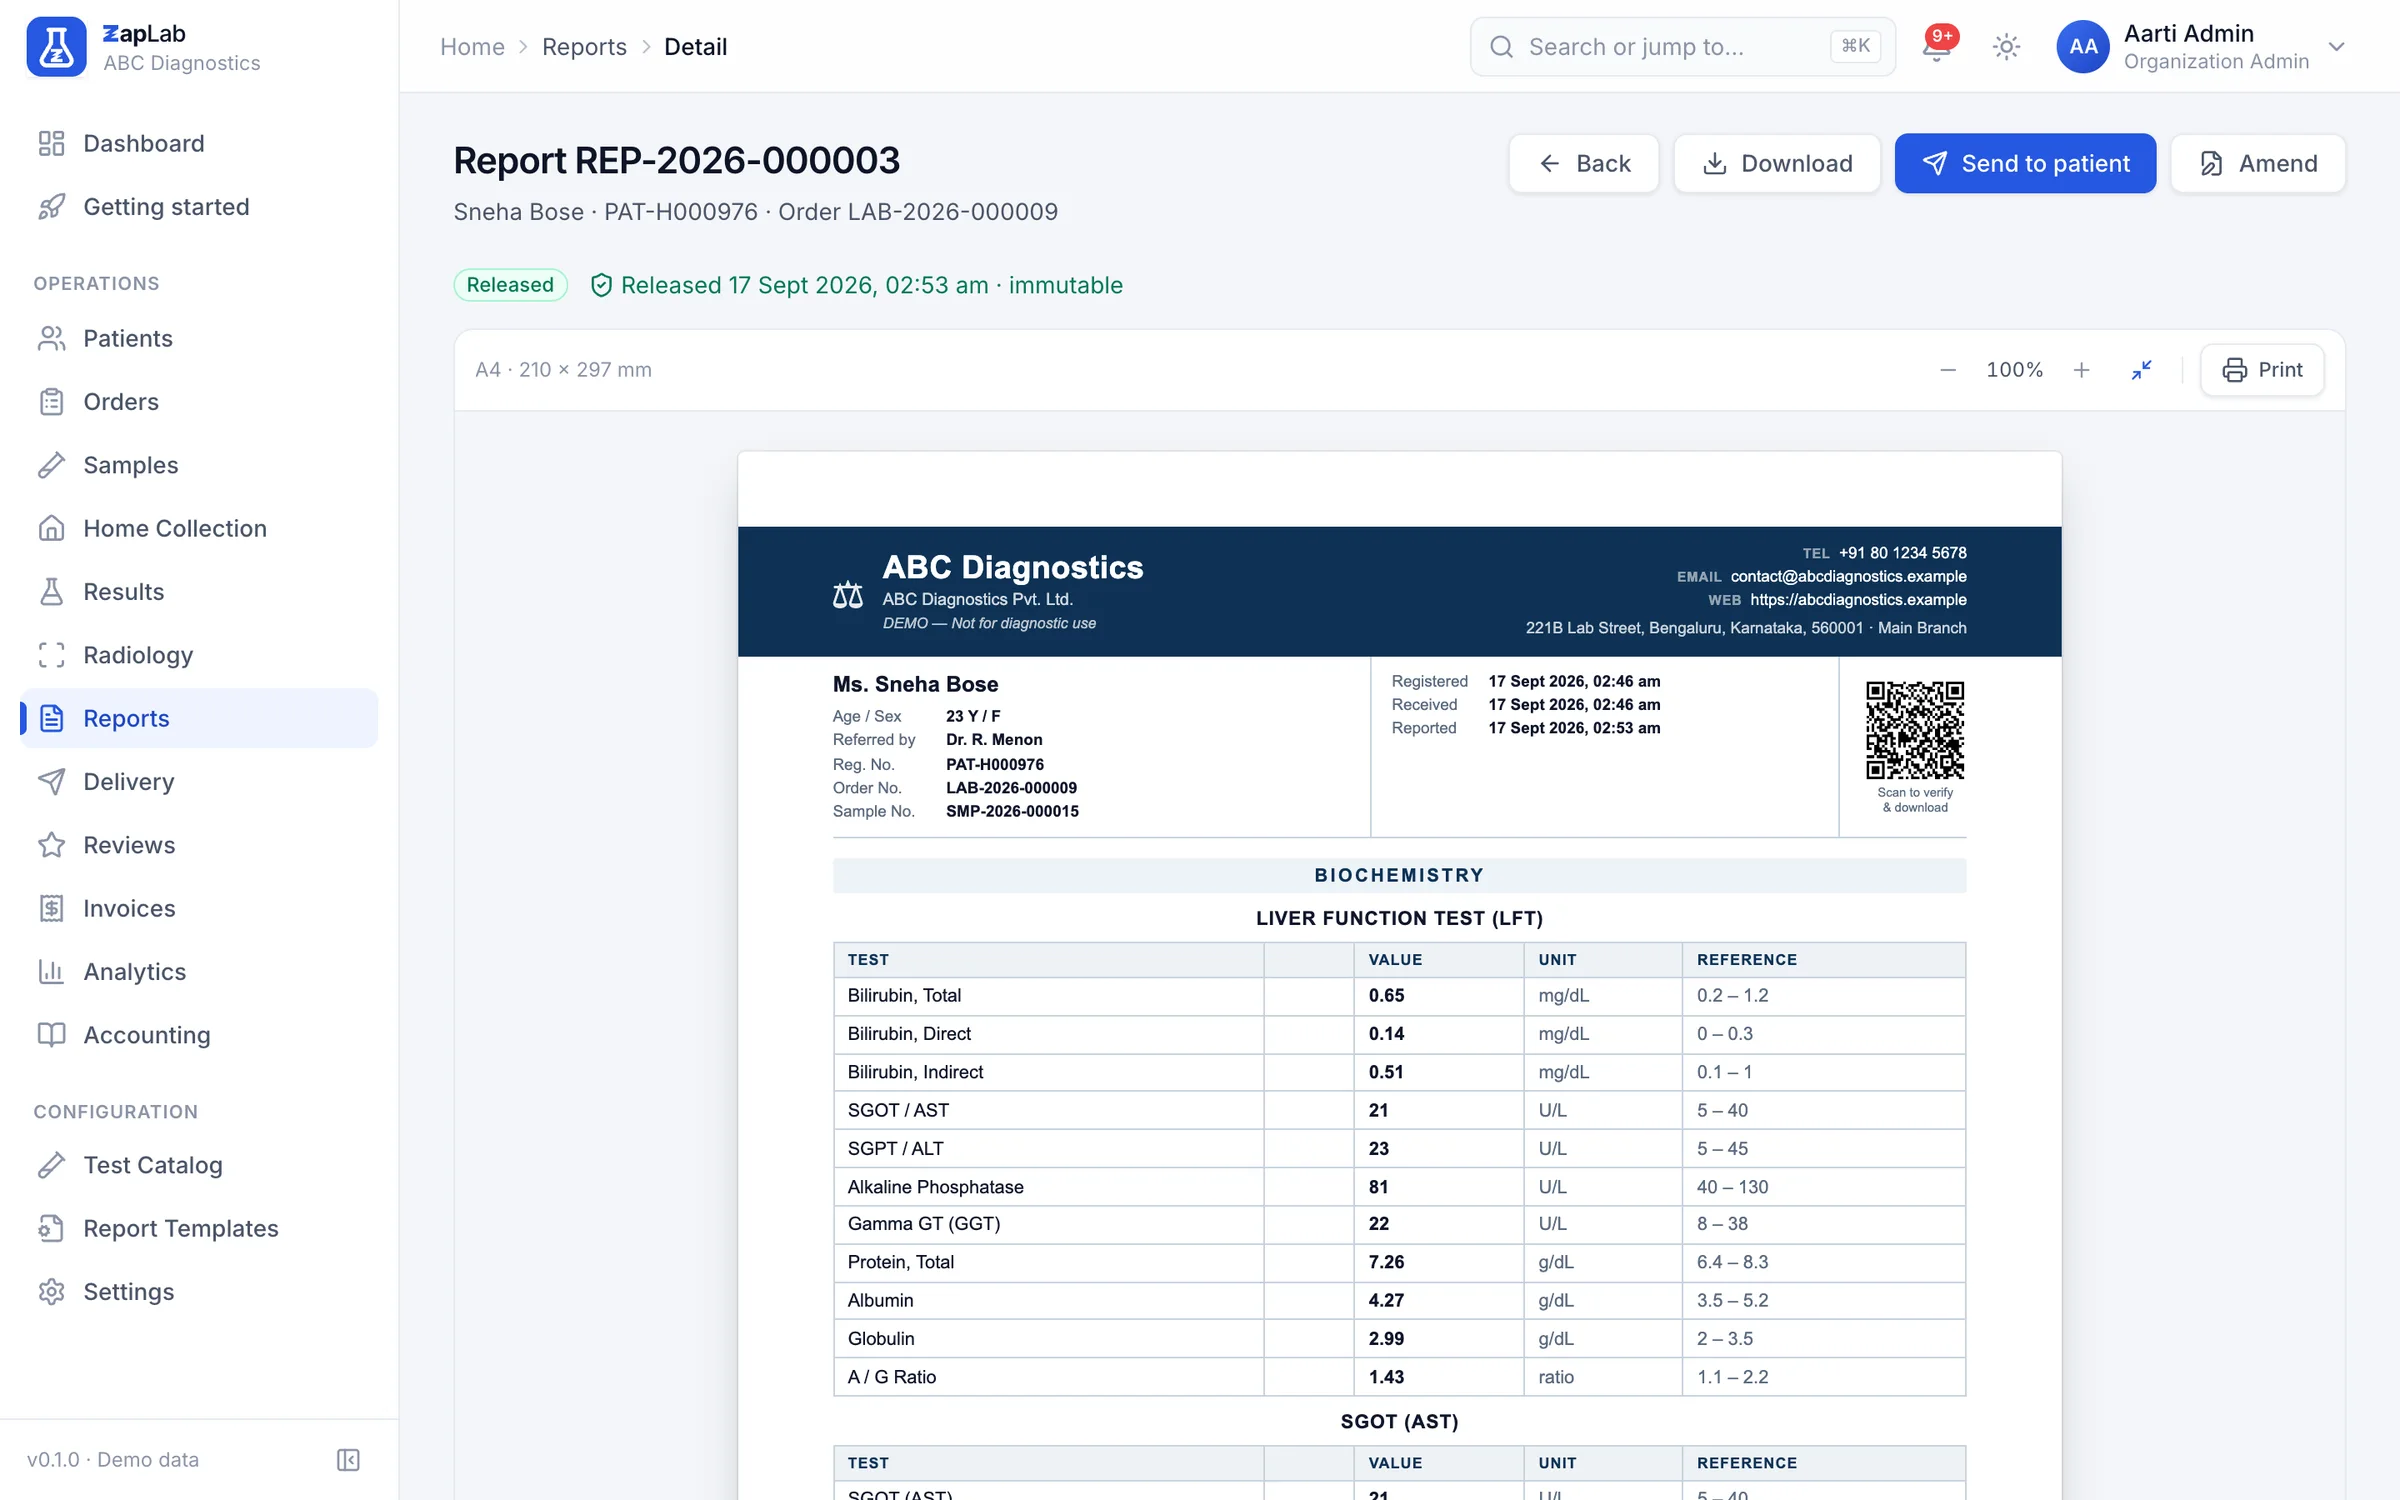
Liver Function Test (LFT)
11 parameters, 3 of them calculated · 4 h turnaround
Demo datafictional patient, sample values
ABC Diagnostics
18 Jyoti Nivas Road, Koramangala, Bengaluru 560095
Your accreditation line prints here
- Report
- RPT-2026-01921
- Sample
- S-260912-031
- Patient
- Arun Deshpande (demo)
- Age and sex
- 52 y, male
- Patient ID
- ABC-2026-0312
- Referred by
- Dr. S. Iyer
- Collected
- 12 Sep 2026, 08:40
- Reported
- 12 Sep 2026, 12:25
Liver Function Test (LFT)
Biochemistry · Serum · LFT
| Parameter | Result | Unit | Reference | Method |
|---|---|---|---|---|
| Bilirubin, Total | 0.90 | mg/dL | 0.2 – 1.2 | Spectrophotometry |
| Bilirubin, Direct | 0.25 | mg/dL | 0 – 0.3 | Spectrophotometry |
| Bilirubin, Indirectcalculated | 0.65 | mg/dL | 0.1 – 1 | Spectrophotometry |
| SGOT / AST | 38 | U/L | 5 – 40 | Spectrophotometry |
| SGPT / ALT | 62H | U/L | 5 – 45 | Spectrophotometry |
| Alkaline Phosphatase | 104 | U/L | 40 – 130 | Spectrophotometry |
| Gamma GT (GGT) | 58H | U/L | 10 – 55Male | Spectrophotometry |
| Protein, Total | 7.40 | g/dL | 6.4 – 8.3 | Spectrophotometry |
| Albumin | 4.30 | g/dL | 3.5 – 5.2 | Spectrophotometry |
| Globulincalculated | 3.10 | g/dL | 2 – 3.5 | Spectrophotometry |
| A / G Ratiocalculated | 1.39 | ratio | 1.1 – 2.2 | Spectrophotometry |
Parameters marked calculated are computed by the system from the measured values on this sheet, not typed in.
Critical limits on the flagged parameters: SGPT / ALT > 1000 U/L. No value in this report has reached one.
Interpretation
Two values fall outside the reference range and are flagged. Indirect bilirubin, globulin and the A/G ratio are calculated from the measured values. Correlate clinically.
Dr. Meera Nair, MD (Pathology)
Electronically signed 12 Sep 2026, 12:25
Dr. Anil Kumar, MD (Pathology)
Second signatory
Scan to verify
this report
Page 1 of 1 · End of report
Kidney Function Test (KFT)
13 parameters, 4 of them calculated · 4 h turnaround
Demo datafictional patient, sample values
ABC Diagnostics
18 Jyoti Nivas Road, Koramangala, Bengaluru 560095
Your accreditation line prints here
- Report
- RPT-2026-01934
- Sample
- S-260912-038
- Patient
- Mohammed Irfan (demo)
- Age and sex
- 61 y, male
- Patient ID
- ABC-2026-0313
- Referred by
- Dr. A. Pillai
- Collected
- 12 Sep 2026, 09:05
- Reported
- 12 Sep 2026, 12:50
Kidney Function Test (KFT)
Biochemistry · Serum · KFT
| Parameter | Result | Unit | Reference | Method |
|---|---|---|---|---|
| Blood Urea | 42 | mg/dL | 15 – 45 | Spectrophotometry |
| Blood Urea Nitrogen (BUN)calculated | 19.6 | mg/dL | 7 – 21 | Spectrophotometry |
| Serum Creatinine | 1.42H | mg/dL | 0.7 – 1.3Male | Spectrophotometry |
| Urea / Creatinine Ratiocalculated | 29.6 | ratio | Spectrophotometry | |
| BUN / Creatinine Ratiocalculated | 13.8 | ratio | 10 – 20 | Spectrophotometry |
| eGFR (CKD-EPI 2021)calculated | 56L | mL/min/1.73m² | G1 ≥ 90 | G2 60–89 | G3a 45–59 | G3b 30–44 | G4 15–29 | G5 < 15 | Spectrophotometry |
| eGFR Category | G3a 45 – 59 | Spectrophotometry | ||
| Uric Acid | 6.9 | mg/dL | 3.5 – 7.2Male | Spectrophotometry |
| Sodium | 139 | mEq/L | 136 – 145 | Spectrophotometry |
| Potassium | 4.4 | mEq/L | 3.5 – 5.1 | Spectrophotometry |
| Chloride | 102 | mEq/L | 98 – 107 | Spectrophotometry |
| Calcium, Total | 9.2 | mg/dL | 8.6 – 10.2 | Spectrophotometry |
| Phosphorus | 3.6 | mg/dL | 2.5 – 4.5 | Spectrophotometry |
Parameters marked calculated are computed by the system from the measured values on this sheet, not typed in.
Critical limits on the flagged parameters: Serum Creatinine > 8 mg/dL; eGFR (CKD-EPI 2021) < 15 mL/min/1.73m². No value in this report has reached one.
Interpretation
The flagged creatinine is above the reference range for this patient’s sex, and the eGFR calculated from it with the CKD-EPI 2021 equation is below 90. Correlate clinically.
Dr. Meera Nair, MD (Pathology)
Electronically signed 12 Sep 2026, 12:50
Dr. Anil Kumar, MD (Pathology)
Second signatory
Scan to verify
this report
Page 1 of 1 · End of report
Lipid Profile
9 parameters, 6 of them calculated · 4 h turnaround
Demo datafictional patient, sample values
ABC Diagnostics
18 Jyoti Nivas Road, Koramangala, Bengaluru 560095
Your accreditation line prints here
- Report
- RPT-2026-01948
- Sample
- S-260912-042
- Patient
- Sunita Rao (demo)
- Age and sex
- 47 y, female
- Patient ID
- ABC-2026-0314
- Referred by
- Self
- Collected
- 12 Sep 2026, 07:55
- Reported
- 12 Sep 2026, 11:35
Lipid Profile
Biochemistry · Serum · LIPID
| Parameter | Result | Unit | Reference | Method |
|---|---|---|---|---|
| Cholesterol, Total | 212H | mg/dL | Desirable: < 200 | Spectrophotometry |
| Triglycerides | 142 | mg/dL | Normal: < 150 | Spectrophotometry |
| HDL Cholesterol | 52 | mg/dL | > 50Female | Spectrophotometry |
| VLDL Cholesterolcalculated | 28 | mg/dL | 5 – 40 | Spectrophotometry |
| LDL Cholesterolcalculated | 132H | mg/dL | Optimal: < 100 | Spectrophotometry |
| Non-HDL Cholesterolcalculated | 160H | mg/dL | < 130 | Spectrophotometry |
| Total Cholesterol / HDL Ratiocalculated | 4.1 | ratio | < 4.5 | Spectrophotometry |
| LDL / HDL Ratiocalculated | 2.5 | ratio | < 3.5 | Spectrophotometry |
| Triglycerides / HDL Ratiocalculated | 2.7 | ratio | < 3.0 | Spectrophotometry |
Parameters marked calculated are computed by the system from the measured values on this sheet, not typed in.
Interpretation
Total cholesterol is above the desirable limit and is flagged, and the calculated LDL and non-HDL cholesterol follow it. LDL uses the Friedewald equation, valid on a fasting sample. Correlate clinically.
Dr. Meera Nair, MD (Pathology)
Electronically signed 12 Sep 2026, 11:35
Dr. Anil Kumar, MD (Pathology)
Second signatory
Scan to verify
this report
Page 1 of 1 · End of report
Thyroid Function Test (TFT)
3 parameters · 6 h turnaround
Demo datafictional patient, sample values
ABC Diagnostics
18 Jyoti Nivas Road, Koramangala, Bengaluru 560095
Your accreditation line prints here
- Report
- RPT-2026-01952
- Sample
- S-260912-047
- Patient
- Kavita Joshi (demo)
- Age and sex
- 29 y, female
- Patient ID
- ABC-2026-0315
- Referred by
- Dr. N. Bhatt
- Collected
- 12 Sep 2026, 08:20
- Reported
- 12 Sep 2026, 14:10
Thyroid Function Test (TFT)
Endocrinology · Serum · TFT
| Parameter | Result | Unit | Reference | Method |
|---|---|---|---|---|
| Triiodothyronine (T3), Total | 92.0 | ng/dL | 80 – 200 | Chemiluminescence (CLIA) |
| Thyroxine (T4), Total | 6.40 | µg/dL | 5.1 – 14.1 | Chemiluminescence (CLIA) |
| TSH (Ultrasensitive) | 6.850H | µIU/mL | 0.27 – 4.2 | Chemiluminescence (CLIA) |
Critical limits on the flagged parameters: TSH (Ultrasensitive) < 0.01 or > 100 µIU/mL. No value in this report has reached one.
Interpretation
One value falls outside the reference range and is flagged. Correlate clinically and any thyroid medication.
Dr. Meera Nair, MD (Pathology)
Electronically signed 12 Sep 2026, 14:10
Dr. Anil Kumar, MD (Pathology)
Second signatory
Scan to verify
this report
Page 1 of 1 · End of report
What the lab prints
These sheets are HTML on this page. In the product the same report goes out as a PDF.
When a pathologist releases an order, the API builds the report from your template, prints it with Chromium and stores the file, so the PDF a patient opens is the sheet the lab approved. If no browser is available the HTML is stored instead and the report still goes out.
Every report carries its own token. The QR code opens the verification page for that token, which confirms the report was issued by your lab and is unaltered; your lab can require a patient code or a date of birth before any name is shown. Nothing clinical is published on that page.
PDF printing, page size and margins, and the stored-HTML fallback.
Report tokens and the public verification response.
Set up your lab this afternoon.
Create your organisation, add your tests, print the first barcode. If you would rather see it first, ask for a walkthrough.